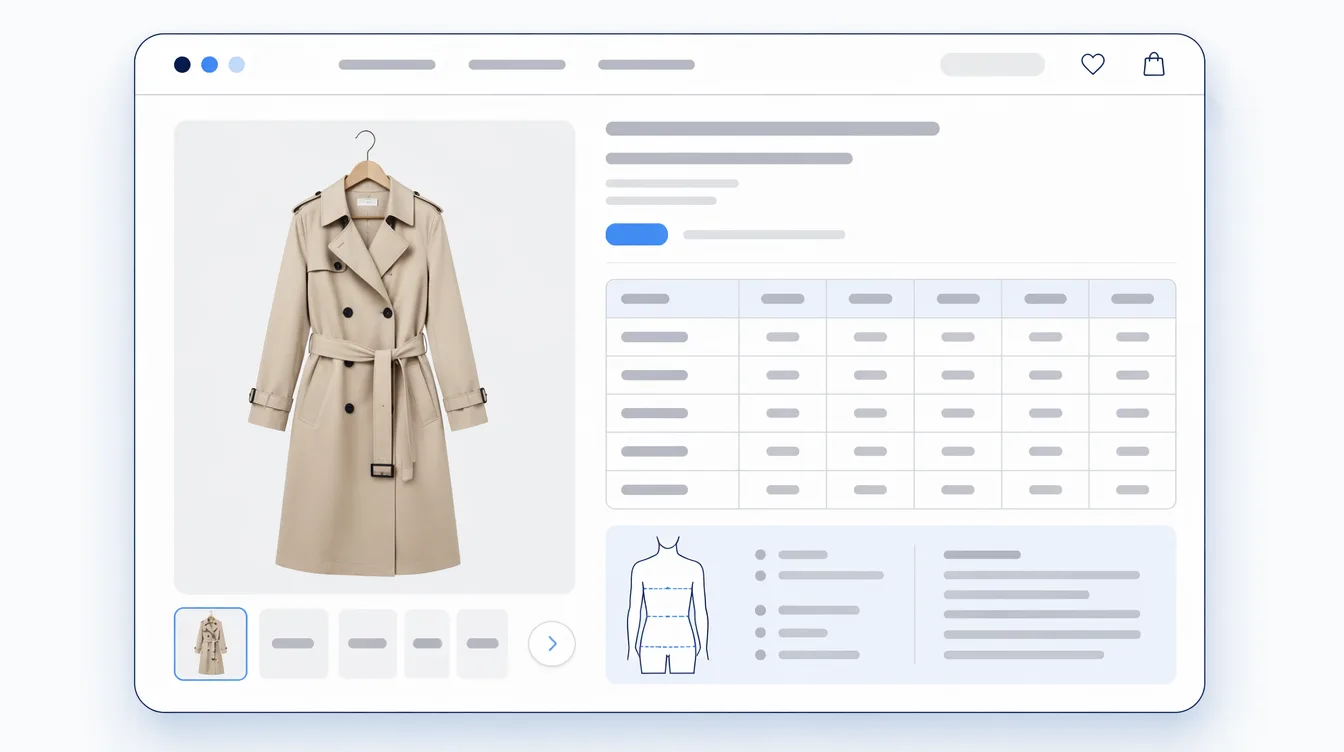

Start looking for a Shopify size chart app and they all seem to say the same thing: fewer returns, dozens of templates, no code required. And broadly, they are all competent at drawing a table. What actually separates them is the unit they bill you on and what they do to your store once installed.
This comparison is built from the official listings of the four leading apps in the category, read on 27 July 2026, and organised into three pricing shapes. It does not name individual apps: what the price is counting matters far more to your bill than whose name is on it. It also covers three checks you can run yourself before installing.

What a Shopify size chart app actually has to do
Having a size chart is no longer the finish line. In Baymard Institute's apparel UX research, 83% of desktop apparel sites and 87% of mobile apparel sites fail to provide sufficient sizing information. Put the other way round, only 17% of desktop sites and 13% of mobile sites get it right.
That gap is rarely "this store has no size chart". It is that the chart on the page does not answer the question the shopper has at that moment. A letter-to-number table with no garment measurements. Centimetres only, for an international audience. Nothing about whether the fabric has any give.
So the question to ask an app is not "can it make a table?" but "can I keep putting everything I need into it?" — which is exactly where the pricing axis starts to matter.
Pricing comes in three shapes
Line the four leading apps up and their pricing resolves into three patterns. All figures were read on 27 July 2026 and will move.
| Shape | Free tier | Paid steps | When the ceiling arrives |
|---|---|---|---|
| A. Stepped by chart count | 2–3 charts (some watermarked) | ~$5 for 10 charts, ~$12 for 20, unlimited around $25 | As your range widens. Driven by product variety, not sales |
| B. Chart count plus monthly usage | 3 charts with 10 recommendation requests, or 2 charts | 800 / 2,000 / 5,000 requests a month, or 100 quiz users a month | In peak season. The more you sell, the closer you get |
| C. Flat, unlimited charts | 3 charts, watermarked | ~$5 for unlimited | No unit grows, so there is no ceiling |
Ratings across the four run from 4.4 to 5.0, and review counts from 122 to 1,080. The spread in review counts is not a ranking. A high count reflects longevity; a low one reflects being newer. Few reviews make a track record hard to judge; many also accumulate "it used to be good" verdicts. Reading the negative reviews from the last twelve months tells you far more than the star average.
The pricing axis is what will catch you out
The most important column above is the last one. Whether that unit grows as your store grows decides what you will actually pay.
When shape A (chart count) bites
"Up to 10 charts" sounds generous until you sell apparel. Tops and bottoms need different tables; menswear and womenswear differ again; add wholesale brands and every supplier brings its own. A 40-product store needing more than 15 charts is entirely ordinary.
How to check: group your current products by "can share one measurement table" and count the groups. That number — not your product count — is how many charts you need.
When shape B (usage) bites
Limits counted per month — recommendation requests, quiz users — tighten exactly as you sell more. Slack in the quiet months, short in the busy ones.
The thing to establish is what happens when you hit the cap: an overage charge, or the feature stops for the rest of the month? If it stops, your size guidance disappears during your best sales month. If the listing doesn't say, ask support before installing — how fast and how specifically they answer doubles as a preview of their support quality.
When to take shape C (flat)
A plan with no growing unit is genuinely easier to budget for. But cheap often has a reason: among these four, the cheapest flat option also carries the lowest rating (4.4). Predictable pricing and having the features you need are two separate questions; confirm both.
Three things to check before you install
These apply whichever app you choose, and you can test all three yourself on a free plan.
1.Does it slow your product page down?
A size chart loads on every product page view. If the app injects JavaScript across your whole storefront, it also slows the pages of shoppers who never open the chart.
Install it on the free plan, then compare PageSpeed Insights before and after. Watch CLS (layout shift) in particular: a chart that loads late and pushes the rest of the page down will move the buy button out from under someone's thumb.
2.What happens to your data when you uninstall?
Size charts take real time to build. If that work only exists on the vendor's servers, it disappears when you cancel — and every future switch means starting over.
Two things to establish: can you export to CSV (the minimum escape hatch), and is the data stored in your own Shopify metafields (in which case it stays in your store after uninstall). Even the first alone is a meaningful difference, so run an export while you are still on the free plan.
3.Will a theme update break it?
An app that reads your theme's HTML structure can break when you update or switch themes. Apps built as Shopify theme app extensions (app blocks) run without editing theme code, which makes that class of breakage far less likely.
Look for "Works with: Online Store 2.0" on the listing, and setup instructions that say "add the block in the theme editor". If the instructions say "paste this tag into your theme code", expect to fix it again after every theme update.
The case for not installing anything
Honestly: with around ten products and a simple size run, Shopify's native metafields and your product description are enough. A hand-written HTML table in the description is far better than nothing.
An app starts earning its keep when:
- you want to reuse one table across dozens of products (copying it each time stops being realistic)
- you need per-product notes on top of a shared table (central management and individual tweaks)
- you need to show centimetres and inches, or local and international size runs
- you want to measure the effect against your actual return data
Until then, the monthly fee is hard to justify — and that is a fine place to be.
How Mitasu for Apparel answered the same question
To be clear first: all three shapes above are reasonable designs, and none of them is unfair. What follows is not a ranking — it is the answer we chose to the same problem, and what we gave up to choose it. Read it as another data point.
No unit that grows
Chart count, product count, order volume, number of shopper responses — none of them changes the price. It is flat.
The reason is section three of this article. We wanted to remove the experience of hitting a ceiling, and in particular the case where a cap is reached in peak season and size guidance stops. That is the worst way for an app like this to fail: the information disappears in the month it is needed most.
What we gave up: there is no high-tier plan for large stores. When a merchant's sales grow, our revenue does not. It is an inefficient business shape, and we accepted it rather than ship an app people use while watching a meter.
Not one script added to the storefront
The only thing loaded on the product page is the theme app extension block. No global JavaScript is injected. Tab switching and the centimetre/inch toggle are built to work without any additional script at all.
Measured: Lighthouse 92, TBT 30 ms, CLS 0. Getting CLS to zero — the chart never appearing late and pushing the buy button down — is precisely the check this article asks you to run, and we could not in good conscience ask for it without meeting it.
What we gave up: elaborate animation and visual flourish. It is not an app that impresses through motion.
It never reads your theme's HTML
We do not touch the theme's DOM and do not hook variant selection; the only thing read is metafields. That means there is structurally no surface for a theme update to break.
What we gave up: the experience where choosing a variant swaps the chart automatically. Where variants differ in measurement, we show them side by side instead of switching. That is the price of not depending on the theme's JavaScript.
Apparel only, deliberately
The app is apparel-specific. Extending it to pet supplies or furniture would multiply the addressable market, but the depth — the measurement diagrams, the girth-first check of whether a garment can physically be worn, size suggestions that account for stretch — would certainly thin out.
What we gave up: it is not suitable for stores selling outside apparel. If you want one app covering homeware and furniture too, a general-purpose app is the rational choice.
Getting your data out is not a paid feature
Size charts are stored in your store's own metafields, not on our servers. The data stays in your store after uninstall, and CSV export is included on the free plan.
Having told you to establish how you get your data out before you put data in, we could not design something that failed our own check.
It is available now on the Shopify App Store; the details are on the Mitasu for Apparel page.
How to decide
- Count the charts you actually need first. Groups that can share measurements, not products. Without that number you cannot tell which tier is right.
- Check whether the billing unit grows with your sales. Request and user caps bite hardest in your busiest month.
- Always install on the free plan and compare page speed before and after. The numbers don't negotiate.
- Establish how you get your data out before you put data in. Afterwards is too late.
- Read recent negative reviews, not the star average. "Slow", "broke", "support never replied" never appear on a feature list.
We have set out our own reasoning above, but apply the five checks to every candidate, ours included. However sound a design philosophy sounds, it is worthless if it does not fit your catalogue. That fit is the only test that decides anything.
Sources: Baymard Institute — Apparel: 10 Best Practices on Sizing; Shopify — Theme app extensions. Pricing shapes, free tiers, ratings and review counts were read directly from the official listings of the four leading size chart apps on the Shopify App Store on 27 July 2026 (individual apps are not named in this article). All of it moves — check again yourself when you decide.